For those who have been living under a rock, let’s hope it was gold, because the shiny metal is up over 50% year-to-date (YTD) compared with 18% for the S&P 500 (with dividends). With this recent outperformance by gold, some are starting to question whether investing in stocks still makes sense.
For example, I saw a chart like this going viral which compared the growth of $1 invested in gold versus the S&P 500 since January 2000:

As you can see, gold has outperformed the S&P 500 (with dividends) by nearly 2x since 2000. After seeing something like this it’s easy to question why you would ever own stocks. If a glittering rock can outperform productive businesses, what’s the point of owning stocks at all?
While this comparison is technically accurate, it’s also quite misleading. Not only were U.S. stocks in the midst of their largest bubble ever (during the DotCom boom), but gold was still down over 50% from its highs in the late 1970s. By starting in the year 2000, you are comparing U.S. stocks at their most expensive to gold near its cheapest. This is the Mike Tyson vs. Jake Paul comparison of investing. One was out of their prime and the other wasn’t.
I can similarly stack the deck against gold by starting the performance comparison in January 2012, as gold reached new all-time highs. If you did so, you would see that the S&P 500 outperformed gold by 2.7x since then:

So which is it? Is investing in gold a better bet than stocks? Or is the yellow ore bound to disappoint?
Truthfully, it’s a bit of both. Over long periods of time, U.S. stocks tend to outperform gold. You can see this in the chart below which shows the growth of $1 invested in the S&P 500 versus gold since 1990:

That’s a 4x difference in return over the last 35 years.
However, there are also periods where gold absolutely crushes U.S. stocks. The 1970s were one such period. During this decade, gold was up 1,365% while U.S. stocks only ended up 76% (from Ben Carlson’s recent post on why he doesn’t own any gold):

Can you imagine not owning gold when this happened? It would’ve been one of the most FOMO-inducing moments in investment history.
This is one of the reasons why gold remains popular as an asset class. Though it usually underperforms, it has rare moments where it triumphs. And in these triumphs it can be quite effective in a diversified portfolio.
But what’s happening with gold today? It’s outperforming, yet U.S. stocks aren’t struggling. The investment environment is nothing like the 1970s or 2000s, so what’s going on? Warren Pies summarized the sentiment shift perfectly a few months ago:
The fear of losing ground (i.e., purchasing power) is replacing the fear of losing principal.
Investors have a lot of anxiety around the stability of the U.S. dollar with soaring debt levels, an ongoing trade war, and the threat of continued inflation. These fears aren’t unfounded either. The U.S. deficit is tracking about the same as in 2024 and CPI has also increased from 2.3% in May to 2.9% in August. With the possible loss of purchasing power for the U.S. dollar, investors are piling into assets that are typically thought to be inflation hedges (e.g. gold, silver, etc.).
And when I say “piling in,” I mean it. As the World Gold Council reported:
Global physically backed gold ETFs recorded their largest monthly inflow in September, resulting in the strongest quarter on record.
But demand isn’t just coming from retail investors, it’s coming from central banks too. Due to recent buying activity, foreign central banks now hold more gold than U.S. Treasuries for the first time since 1996 (h/t Reuters):

More importantly, gold is now the second-largest global reserve asset after the U.S. dollar.
Here’s the ironic part though—investors are buying into gold partially as an inflation hedge, but it’s never been a great inflation hedge. Historically, every time inflation has been above 4%, the best assets to own were REITs and equities, not gold. The table below illustrates this by showing the median real return (when inflation exceeded 4%) by asset class from 1972-2021:
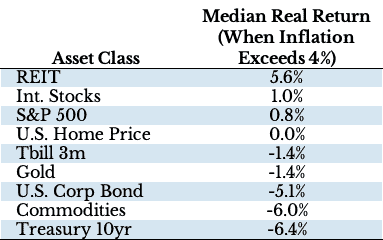
Gold had a -1.4% real return during these inflationary periods. And during our most recent bout of inflation in 2022, gold was flat as well.
Yes, gold did go up 33% from January 2020 to August 2020, but it didn’t do much afterwards, as inflation skyrocketed. The chart below shows this initial price increase followed by a longer whipsaw (during the actual inflationary period):

While investors are certainly forward-looking, do you think they anticipated all of the inflation from 2021-2022 and bid up gold’s price accordingly by August 2020? Call me skeptical.
Either way, gold is rising because more people are buying than selling. Whether they are buying because of a weakening dollar, geopolitical uncertainty, possible future inflation, or some mix of these factors is up for debate.
Is this confluence of factors pushing gold into bubble territory? I don’t know. But I do know that, historically, gold tends to move in fits and starts. It goes on great runs and then has decades with nothing to show for it. Not everyone can handle these lost decades. I’m not even sure I can, and I have a small allocation (3%) myself.
I have a long love-hate relationship with gold. I invested in it many years ago, but publicly abandoned it in 2017 after examining the data. Those multi-decade drawdowns were a no-go for me.
But, as it started to rise in 2024, I looked at the data again and realized that I was missing the forest for the trees. Yes, gold performs poorly as an individual asset class, but its diversification benefits within a portfolio are hard to argue against. As the World Gold Council noted:
Our analysis shows that gold has consistently lowered the overall volatility portfolios: on average, the Sharpe ratio increases by 12% when 2.5% of the portfolio is composed of gold, demonstrating a unique diversification effect unparalleled by any other asset.
StateStreet did an analysis from 2005-2025 which found that adding a small gold allocation (from 2% to 10%) to a global multi-asset market portfolio increased the return while decreasing the volatility and maximum drawdown:

As much as I hate to admit it, a little gold can go a long way. So, I added a small (almost trivial) position and moved on.
That decision has worked out well, mostly due to dumb luck. It’s easy to hold onto something while it’s going up. But when gold inevitably declines and has a long stretch of lackluster performance, then come talk to me. I won’t be as cheerful, but I’ll try to hold anyways.
Until then, happy investing and thank you for reading.
If you liked this post, consider signing up for my newsletter.
This is post 474. Any code I have related to this post can be found here with the same numbering: https://github.com/nmaggiulli/of-dollars-and-data

